
Calibration Curve Checks: Looking Beyond the Correlation Coefficient
A high correlation coefficient does not establish that a calibration is fit for reporting sample results. Check the calibration range, response model, residuals, back-calculated standards and appropriate independent controls using the method's predefined criteria.

What does the coefficient leave unanswered?
Correlation summarizes association. It does not show whether a local concentration region is biased or whether the model is appropriate for inverse prediction. The correlation coefficient r and coefficient of determination R² are also different quantities; do not exchange them in a report without identifying what the software calculates. NIST explicitly cautions that a high R² alone is insufficient to establish model fit.
Begin by plotting response against the assigned concentrations and reviewing the actual observations. Keep the concentration units, response basis, blank treatment and preparation lineage visible. A polished regression report cannot repair a wrong standard concentration or a transcription error.
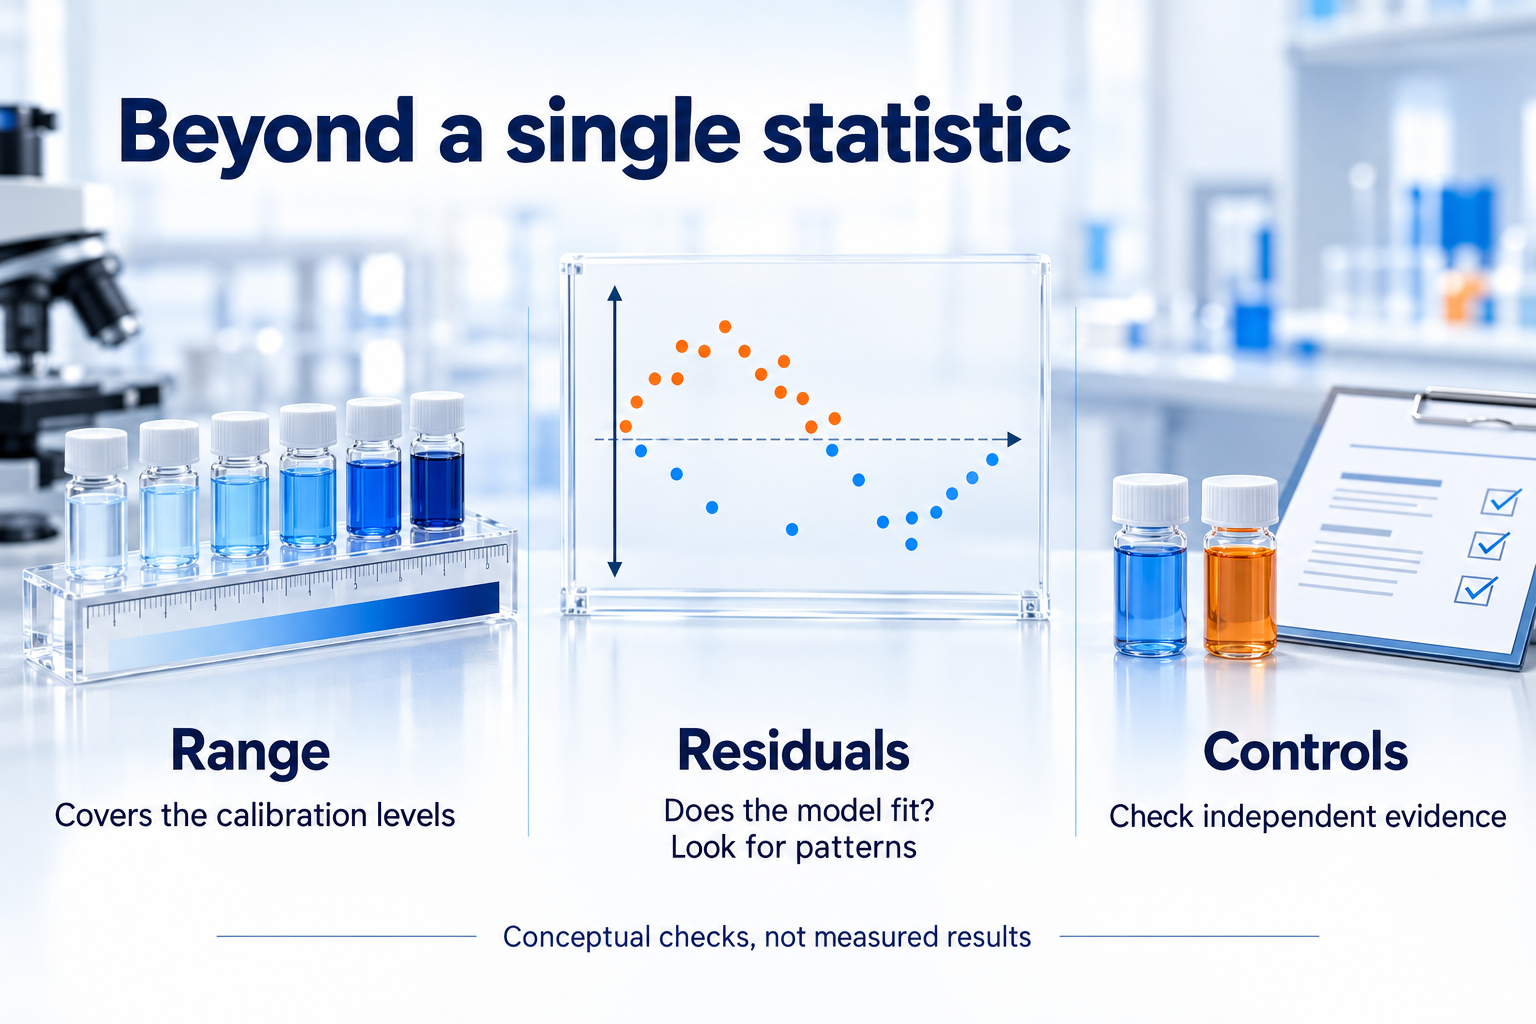
Read residuals in the correct units
A response residual is observed response minus model-predicted response at a calibration concentration. Curvature can suggest an inadequate functional form, while increasing spread may indicate non-constant variability. These patterns are prompts for investigation, not diagnoses by themselves. Examine run order and preparation information as well as concentration.
| Check | Question to resolve |
|---|---|
| Residual pattern | Does model error show a systematic structure? |
| Back-calculated standard | What concentration does the fitted model return for each standard? |
| Independent QC | Does evidence separate from the fitted points support performance? |
| Blank and carryover review | Could background or sequence effects influence the curve? |
Use weighting for a demonstrated reason
When response variability changes across the range, a justified weighted fit may be appropriate. NIST describes weighting in relation to error variance. A familiar weighting choice such as 1/x is not automatically correct for every assay. Evaluate the selected model across the intended range, using residual diagnostics appropriate to the weighting and concentration-based performance checks.
Do not choose weighting merely because it improves one summary statistic. Record the candidate model, rationale, evaluation and authorized final choice. Avoid removing calibration levels or forcing an intercept just to obtain a better-looking coefficient. Follow documented investigation and exclusion rules.
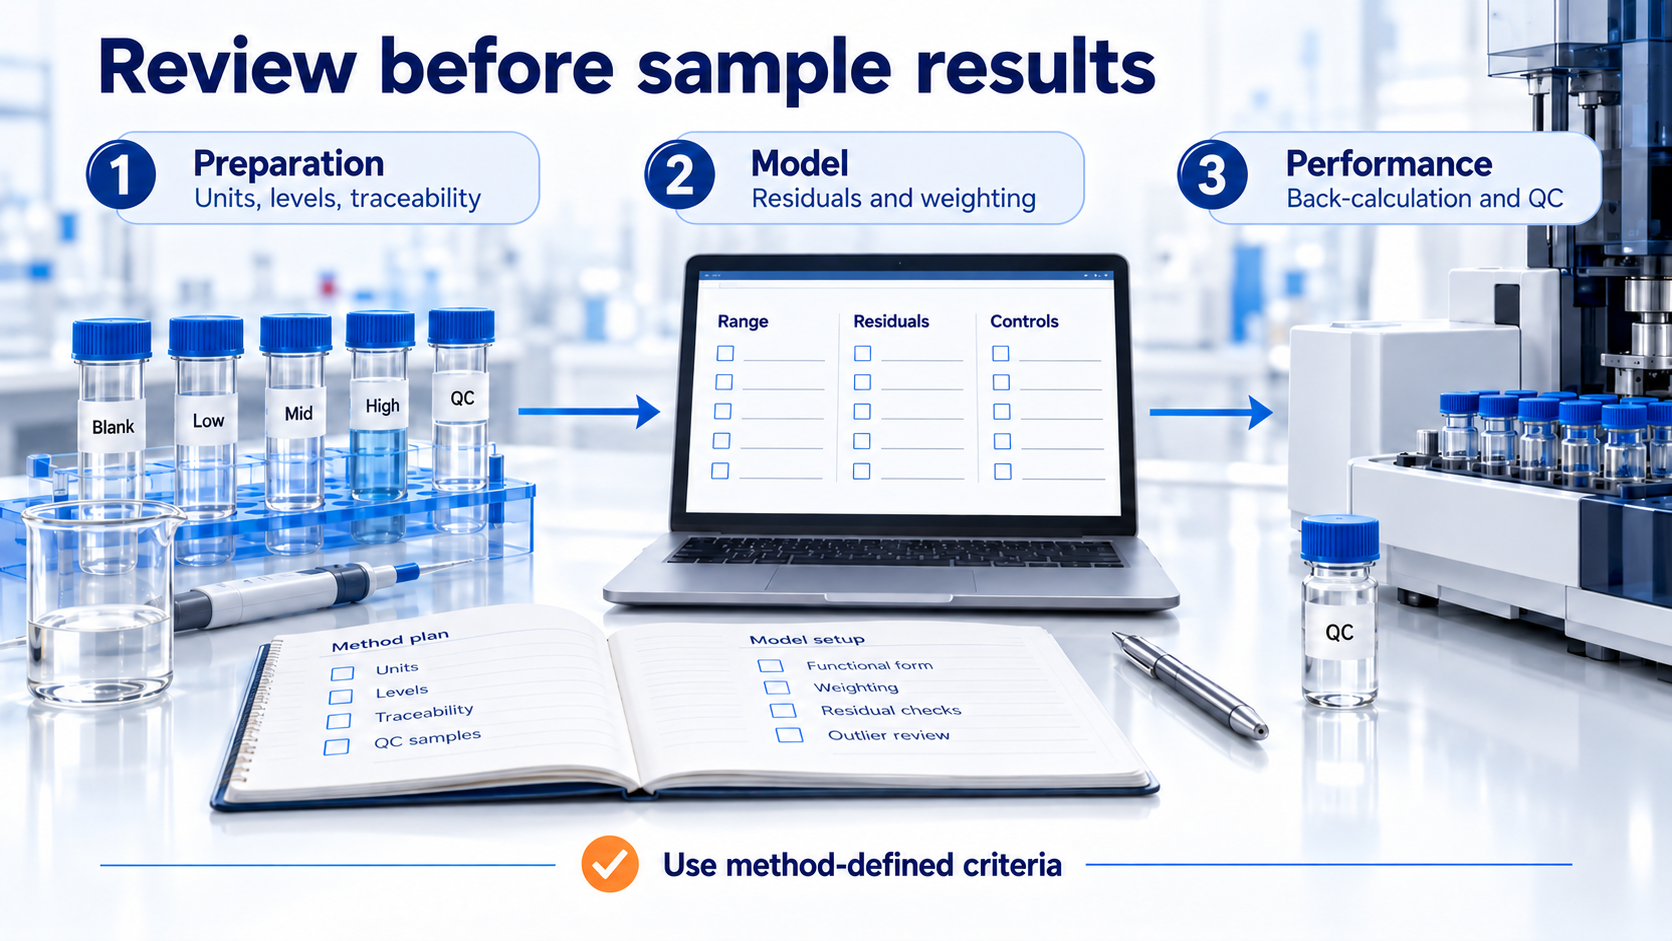
Back-calculation and independent checks answer different questions
Back-calculated standards use the fitted model and therefore are not independent validation samples. An independently prepared or independently sourced QC material, as appropriate to the method, can help reveal errors shared by calibration preparations. Its suitability still depends on matrix, concentration, traceability and the purpose of the check.
For a linear response model y = a + bx with nonzero slope, the inverse calculation is x = (y − a)/b. Retain the response units and concentration units so that the result is interpretable. Do not apply this inverse to a nonlinear model. Samples outside the demonstrated range require the procedure's authorized approach, rather than automatic extrapolation.
Practical conclusion
Review the curve as a measurement model, not a single score. Agree range, model, weighting, control strategy and acceptance criteria before routine reporting. The procurement questions in Prepared Standard Solutions vs In-House Preparation: A QA and Procurement Checklist complement this data review by addressing the quality and documentation of the standards themselves.
Leave a comment!