
Laboratory QC Charts: Spotting Drift Before Results Fail
A laboratory QC chart places comparable control results in time order so that changes in level, spread or direction become visible. It can reveal warning patterns that a single result obscures. It cannot guarantee advance warning, identify a root cause by itself or replace the laboratory's rules for evaluating and reporting results.

Time order adds information
A list sorted by concentration loses the sequence that distinguishes an upward trend from random-looking scatter. A useful chart preserves when each control was measured, what quantity was plotted and the conditions needed to interpret it. Examples include a check-standard result, a blank response or a precision statistic, but these measure different aspects of a process.
NIST's discussion of bias and variability monitoring uses check-standard measurements over time and distinguishes persistent level changes from variability changes. A single chart is not evidence for every analyte, concentration or matrix in a method.
Recognize three different shapes
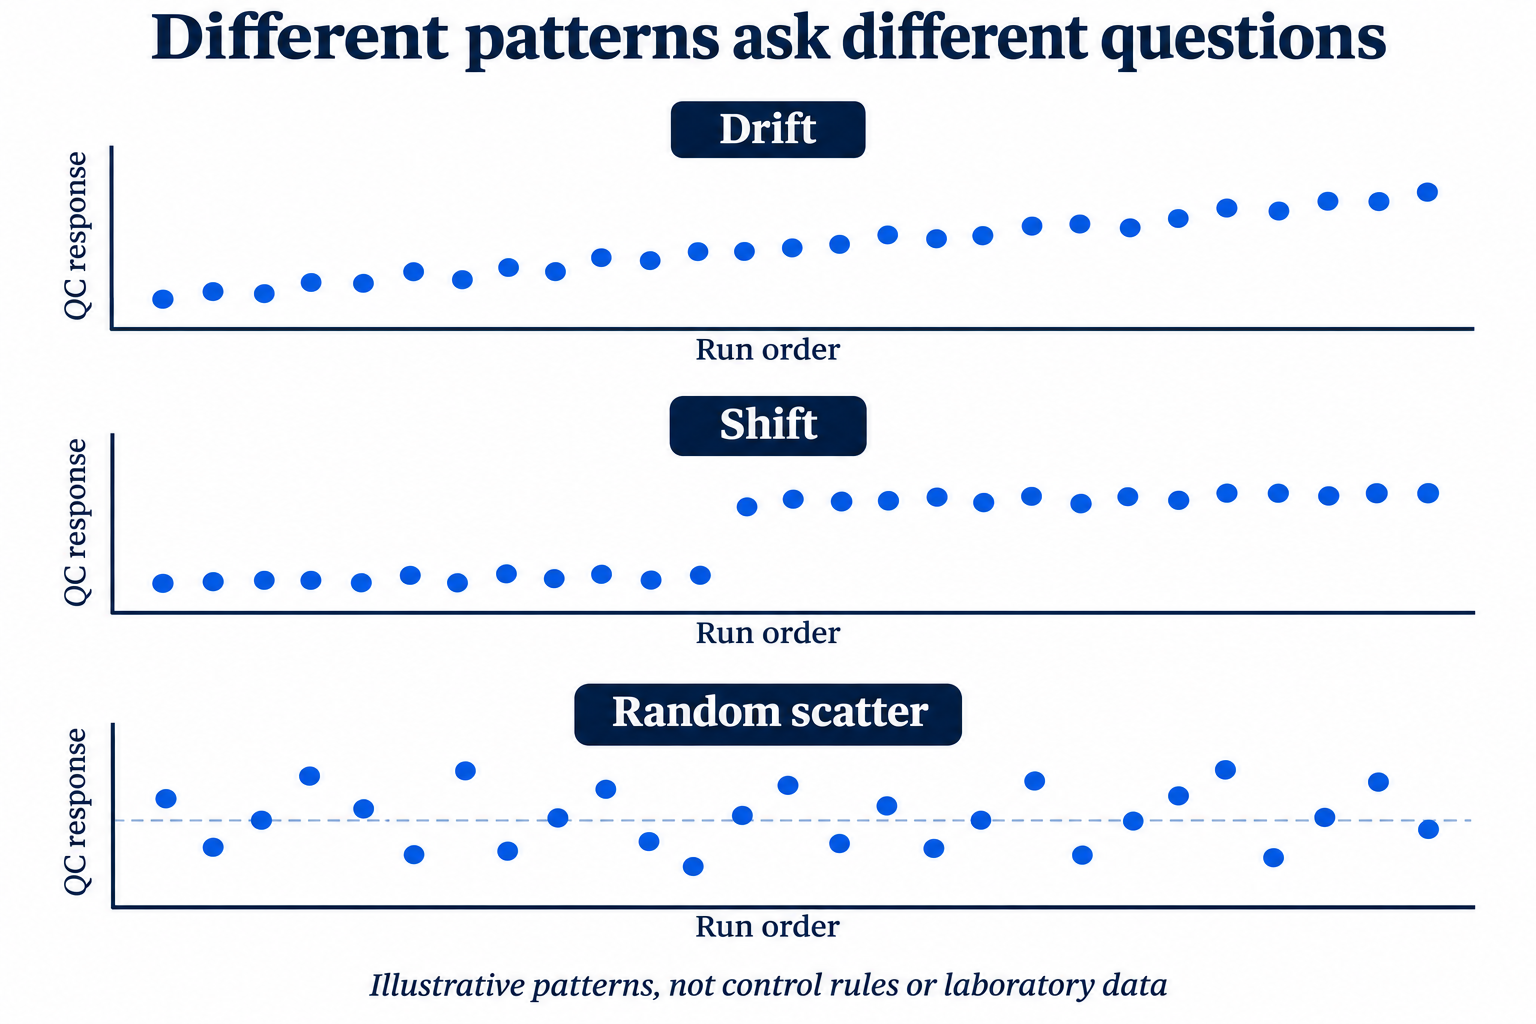
Drift is a progressive change over time. A shift is a change to a different level that persists. Increased scatter is a widening of the variation, which can occur without a similar movement in the average. These are descriptions of patterns, not statistical diagnoses based on appearance alone.
The accompanying illustrations contain invented patterns without action limits. A smooth slope makes the teaching distinction visible, but actual analytical data may be much noisier. A real decision requires the defined chart, suitable reference data and the laboratory's approved interpretation rules.
Compare like with like
Before interpreting a trend, check whether the plotted results have the same response basis, units, control material, concentration level and relevant method conditions. A change in control lot or assigned value may alter the comparison. Combining different methods or concentration levels can create a pattern that does not represent deterioration in either process.
| Record | Why it matters |
|---|---|
| Control identity and assigned value | Distinguishes process change from a change in the material being monitored. |
| Units and plotted statistic | Prevents raw response, concentration, recovery and precision from being treated as equivalent. |
| Sequence date and relevant conditions | Preserves time order and the context of each measurement. |
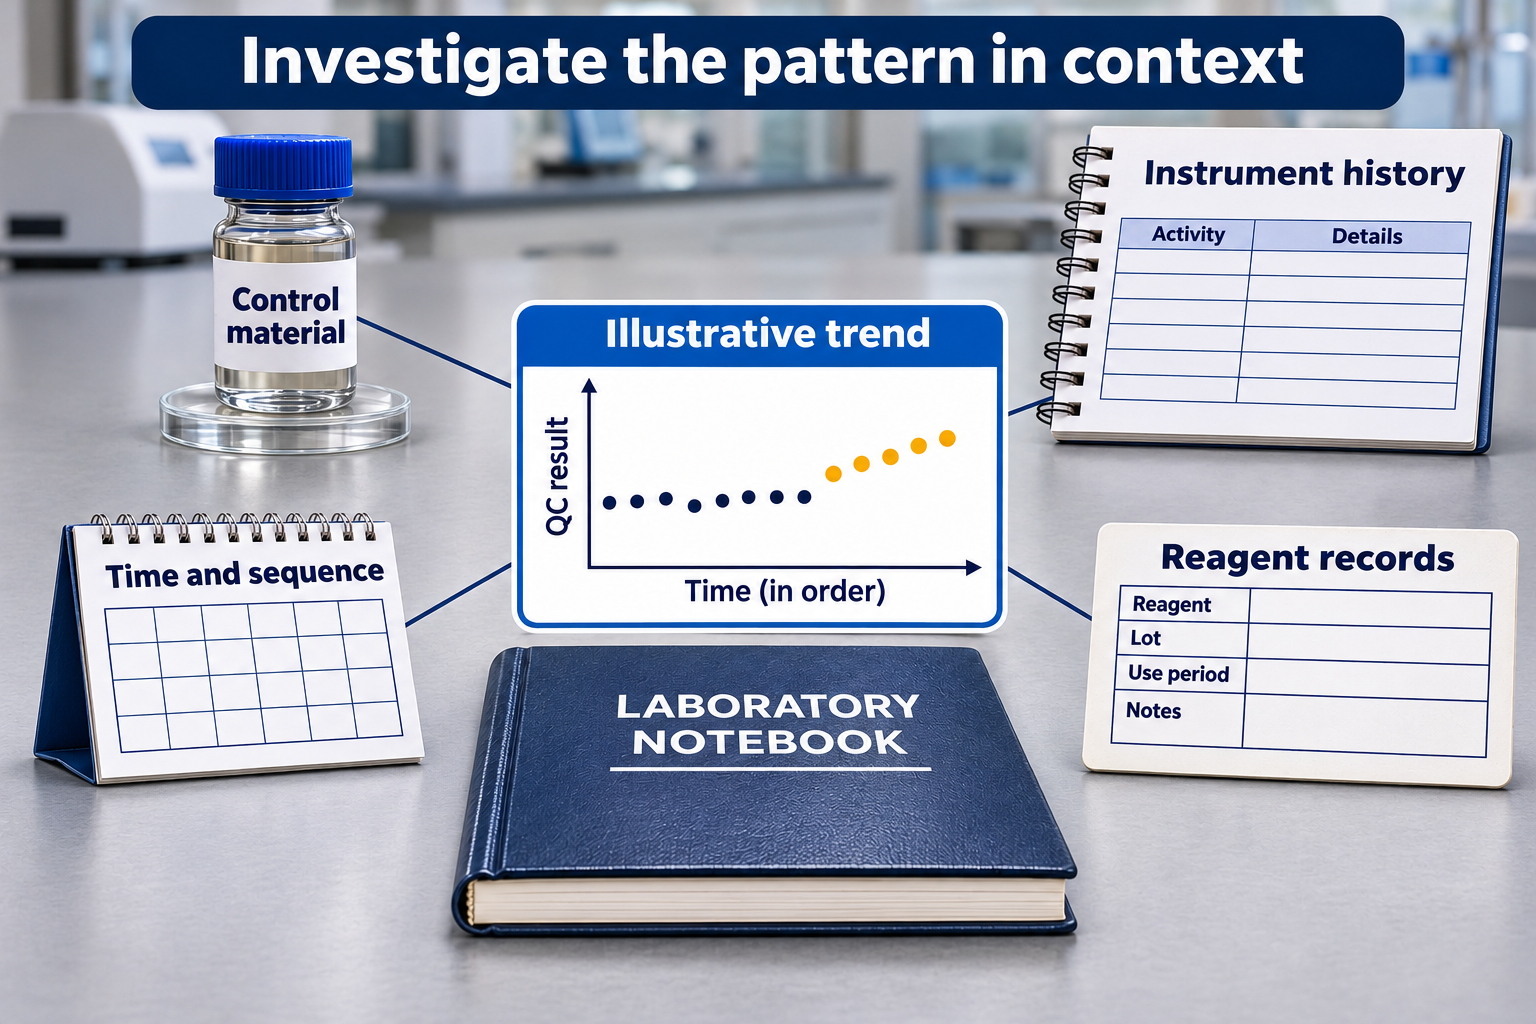
| Maintenance, calibration and lot events | Provides potential explanatory context without proving causation. |
Control limits and specifications answer different questions
NIST distinguishes control limits from specification limits. Statistical control concerns consistency with a process model or history; specifications concern intended requirements. A process can be consistent yet unsuitable for its purpose. Conversely, a result within a specification does not demonstrate that the measurement process is unchanged.
No numerical limits or run rules are supplied here. Their choice depends on the chart statistic, data structure, baseline evidence and intended use. Recalculating limits simply to absorb an unexplained trend can conceal the change being investigated. A documented process change and review of the baseline are different from moving a line to obtain a reassuring chart.
Use a pattern to organize the investigation
First establish that the apparent change is present in the underlying records, rather than a plotting, unit or transcription error. Then compare its timing with documented changes and ask what other controls show. If a blank and a check standard change together, that is different evidence from a change isolated to one control. It remains a hypothesis to investigate.
A chart designed for larger shifts may be less responsive to small gradual changes. NIST's EWMA introduction explains an approach that retains weighted information from earlier observations. This is context for discussion with a qualified quality/statistical reviewer, not a recommendation to replace a validated chart or adopt software defaults.
A useful review ends with a documented question
Record the observed pattern, affected control population, relevant events and unresolved alternatives. Preserve the original observations and any annotations. The authorized quality system determines investigation actions and disposition of affected results. A chart supports that decision process; neither a visually quiet sequence nor an attractive trend plot supplies release authority.
Related Reading
- How Solvent Purity Affects GC Baselines, Blank Runs, and Detection Limits — an application-specific background example; it does not supply universal QC-chart limits.
Leave a comment!